Affordable price, good mechanical properties, and resistance against harsh environmental conditions render glass fibers attractive in technical textile applications. They are extensively consumed in protective clothing against flame and chemicals, filter media in severe circumstances, and reinforcement fiber in polymer composites. Among textile fabric manufacturing techniques; nonwoven fabrics eliminate yarn production and following conversion of yarn into fabrics processes that enhance the production speed and lower costs dramatically. Controlled placement of fibers enhances the isotropy of the nonwoven fabrics that cannot be achieved easily in woven and knitted fabrics. Nonwoven fabrics from randomly oriented short glass fibers are consumed in large quantities by liquid composite molding industry. Resin infusion performances of these fabrics in single- and multiple-layer form are largely dictated by their permeability in thickness direction. Completely wetted and void-free composite production depends on the accurate air permeability characterization of reinforcement fabric stacks.
In this study, air permeability of single-, double-, and triple-layer randomly oriented glass fiber nonwoven fabrics were measured from both front and back faces of the fabric stack, along a pressure drop of 100 and 200 Pa, with test head areas of 20 and 30 cm2 . The results of this study will guide people working on liquid composite molding and its modeling.
Materials vs Methods
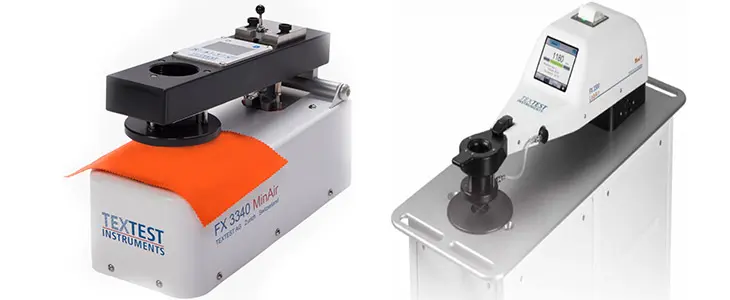
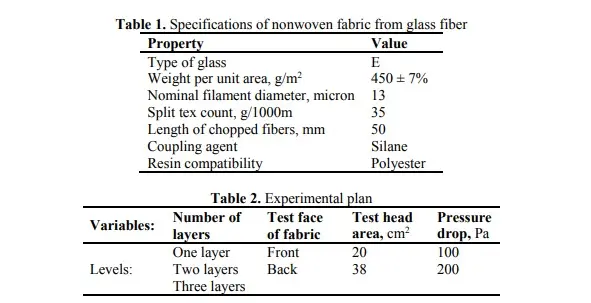
Emulsion bonded chopped strand mat provided by Şişecam Cam ElyafSanayi A.Ş. was used to characterize air permeability behavior of nonwoven fabric from glass fiber. Specification of the fabric is given in Table1.Because reinforcement fabrics are stacked to achieve target thickness during composite production; having a sound understanding about the influence of number of fabric layers on air permeability behavior is valuable. Therefore, we varied number of layers as single, two and three layers within the experimental plan of this study. Fabrics can display different air permeability response depending on the fabric face from which the flowing fluid strikes. Thus, another input variable of this study is testface of the fabric. Air permeability devices are marketed by different test head areas depending on the tightness of the test fabric and power of the device. We also varied test head area as 20 and 30 cm2 to reveal the effect of test head area on air permeability. Another input test parameter is the pressure drop of flowing fluid (air in our case) during test, and commonly used pressure drops are 100 and 200 Pa. We also tried to understand the effect of pressure drop on air permeability performance of nonwoven fabric from glass fiber. Experimental plan of this study is shown in Table 2. Five air permeability measurements from different surface spots were performed for each different combination of independent input parameters, thus in total 120 (5x3x2x2x2) air permeability measurements were completed in this study.
Fabric unwinded from the roll was laid on the table. While top face of the fabric was assumed as front face, bottom face that is in contact with the table was assumed as back face of the fabric. In half set of the measurements the flowing air fluid hit the front face of the fabrics, while in other half set; it hit from the back face of the fabrics. Specimens with an area of 20x25 cm2 were cut from the fabric lying on the table. The specimens with different combination of number of layers were used for air permeability test on SDL ATLAS M021A according to ASTM D737-04. Air permeability unit was selected as cm3/cm2/s - the volume of air (in cm3) passing through per unit area (in cm2) of fabric per unit time (in a second).
Results & Discussion
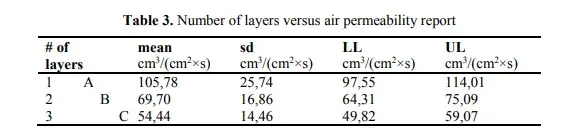
Data analysis indicated that increasing number of fabric layers resulted in statistically significant decrease in air permeability (Figure 2). Each layer level showed statistically significant air permeability than the others (Table 3). Increasing number of layers from one to two layers lowered air permeability at 34 %, while increasing it from two to three layers lowered air permeability at 22%. Two- and three-layer fabric stacks exhibited less air permeability variation than single layer that was attributed to formation of more uniform air flow channels by closure of big and non-uniform pores in one layer by the adjacent layer.
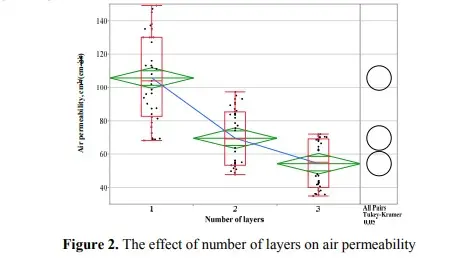
Note: Mean of each layer level is connected through blue line. The top and bottom of each green diamond represent the 95% confidence interval for each layer level. Comparison circles (given on the right column) for means those are significantly different either do not intersect, or intersect slightly.
The effect of test fabric face on air permeability Results indicated that whether flowing fluid (air) strike on front or back face of fabric did not create a statistically significant change (p-value of 0,94) in air permeability, and this result is valid for all number of fabric layer levels (Figure 3, Table 4). This study reveals that during stacking of fabric layers before resin infusion, a specific preference for fabric face orientation does not create an advantage to speed up the permeation of resin through the thickness of the fabric stack.
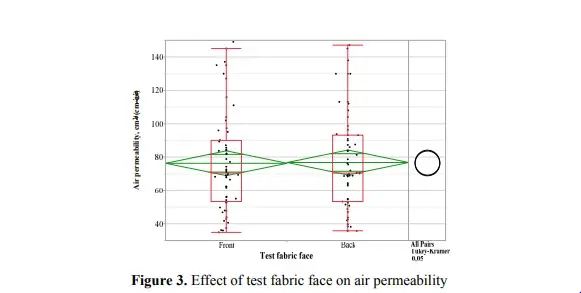
Note: If the comparison circles intersect by an angle of more than 90 degrees, or if they are nested (as shown in the figure), the means are not significantly different.

The effect of test head area on air permeability
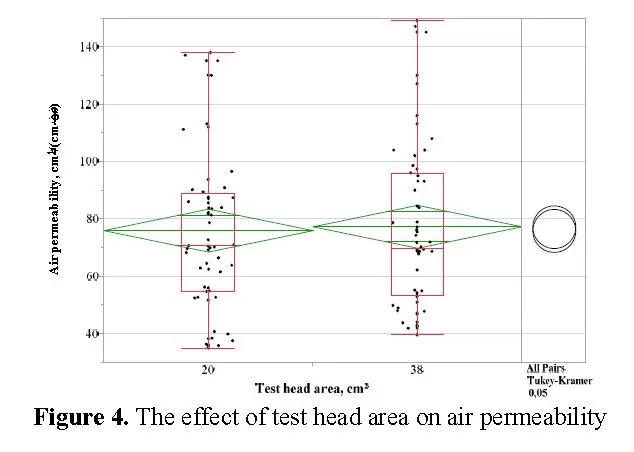
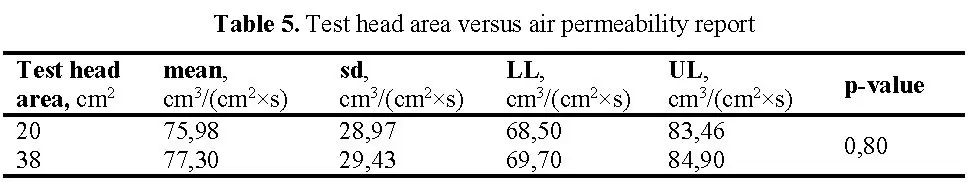
Data analysis indicated there was no statistically significant difference between the air permeability test results of 20 cm2 test head area and that of 38 cm2 . Once steady flow state conditions were achieved at given pressure drop, same volume of air passing through per unit fabric area per unit time for both 20 and 38 cm2 test head areas(Figure 4 and Table 5).
The effect of pressure drop on air permeability
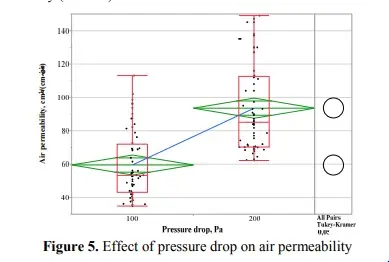
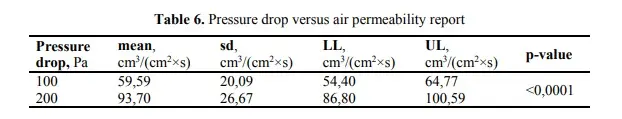
Air permeability tests performed across a pressure drop of 200 Pa resulted in higher air permeability than that of 100 Pa (Figure 5). One hundred percent increase in pressure drop resulted in 57% increase in air permeability (Table 6).
Once the device is run, it tries to achieve a steady state air flow through the test area at given pressure drop by adjusting speed of the air. Once the target pressure drop is achieved, air permeability (in other words average linear velocity of air) is displayed on the screen. A flowing fluid possesses three types of energy; flow energy due to its pressure, kinetic energy due to its velocity, and potential energy due to its altitude with regard to a reference points. These three types of energy can be converted to each other, but their sum is constant along a streamline that is quantified by Bernoulli equation.
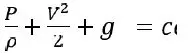
Where P is fluid pressure, V is linear velocity of flowing fluid, g is gravitational acceleration, and z is the altitude of flowing fluid according to a reference point. This equation can be written between two points (point 1 and point 2) along a streamline (Equation 2).
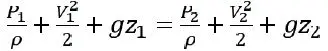
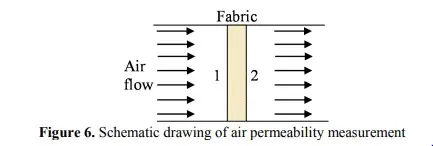
Point one can be regarded as air flow before fabric, while point two is that after the fabric. Velocity of air at point 1 is zero, because it is the air (stationary air) in laboratory atmosphere, while velocity of air at point 2 is the air permeability of the test fabric (Figure 6). Pressure drop (ΔP) is the difference between pressures at points 2 and 1 (ΔP = P2−P1). As pressure drop is increased, flow energy lost by pressure drop is converted into kinetic energy that results in air velocity (air permeability) increase at point 2. Therefore, measurements performed under higher pressure drop results in higher air permeability results. If air permeability of two fabrics is compared, pressure drop must be kept constant.
Conclusion
This study investigated the effect of number of fabric layers, test face of fabric, test head area of the device, and the pressure drop along the flow of the fluid on air permeability of nonwoven fabrics from randomly oriented chopped fibers. Due to closure of open straight channels with enhanced tortuosity in flow channels; increase in number of fabric layers lowered air permeability. The striking face of air over front or back face of the fabric did not affect the air permeability. Similarly, comparable air permeability measurements were obtained at both test head areas of 20 and 30 cm2. Air permeability measurements obtained at pressure drop of 200 Pa resulted in higher values than those at 100 Pa that was explained by Bernoulli equation where the total energy of flowing fluid is constant along a streamline of the fluid.